 Uncategorized
 How War Impacts Crypto Prices: A Complete Guide
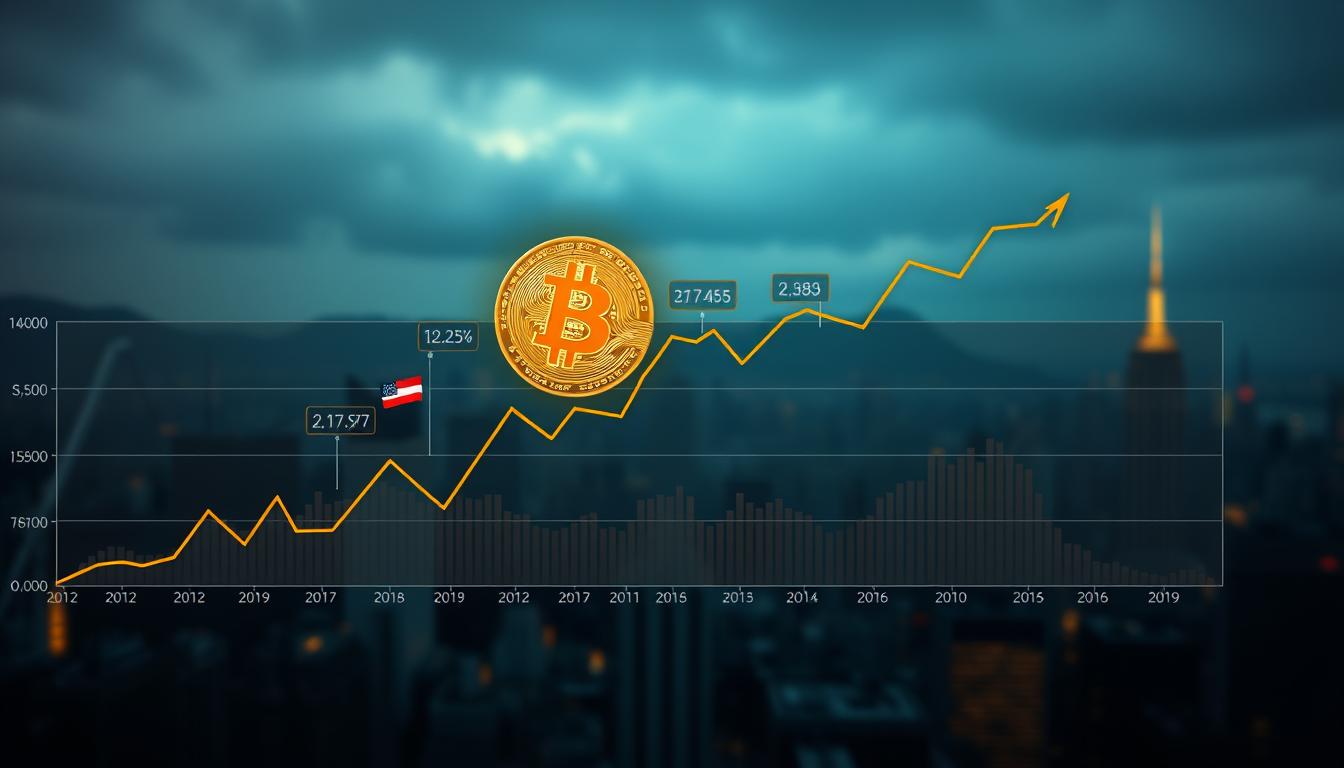
During the Russia-Ukraine conflict in 2022, Bitcoin dropped over 65% from its previous peak. Yet some investors treated the collapse as a buying opportunity rather than a signal to exit. This contradiction sits at the heart of armed conflict and cryptocurrency markets. I’ve spent years analyzing how geopolitical tensions shake financial markets. What strikes me […]
Léon Garnier · Mar 13, 2026